For a full account of the methods and more involved reporting: https://arxiv.org/abs/2004.12398
The graph is interactive, hover over the lines to read the actual values.
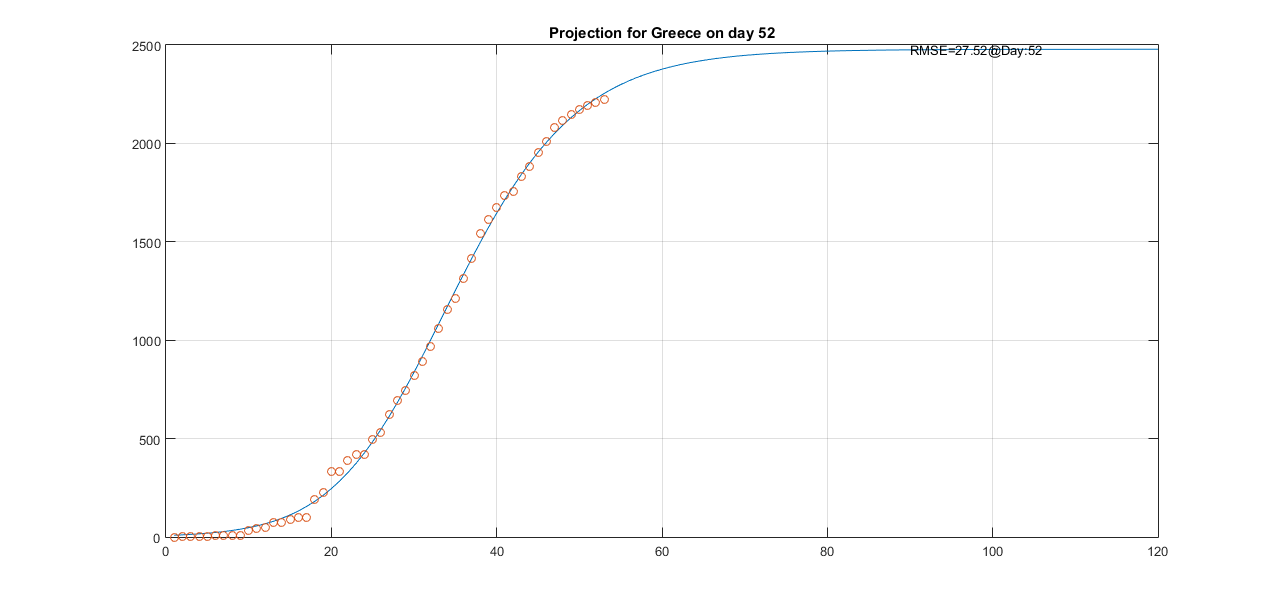
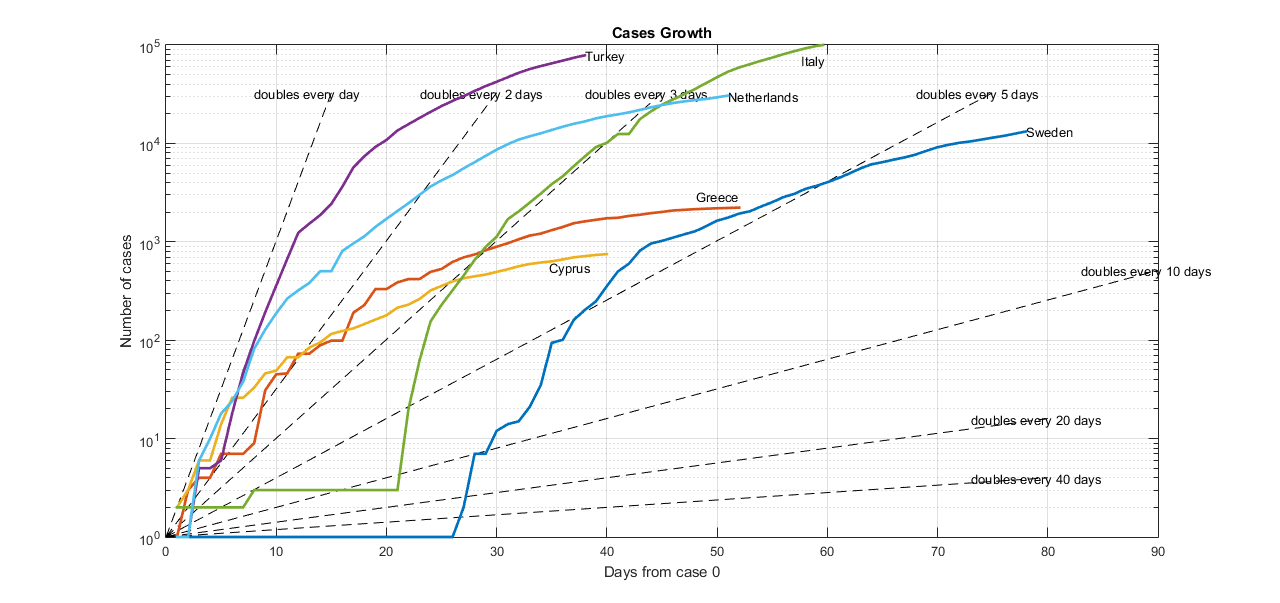
Total number of confirmed cases: projected versus actual
NOTE: 10 confirmed cases are among repatriated people and these normally constitute a separate population. The reason is that Richard’s (as well as SIR) model consider constant population. They were also immediately quarantined and it is unlikely that they will affect the rest of the population. Nevertheless because the number is relatively small compared to the actual cases we have included them in the data.
Projections for Greece
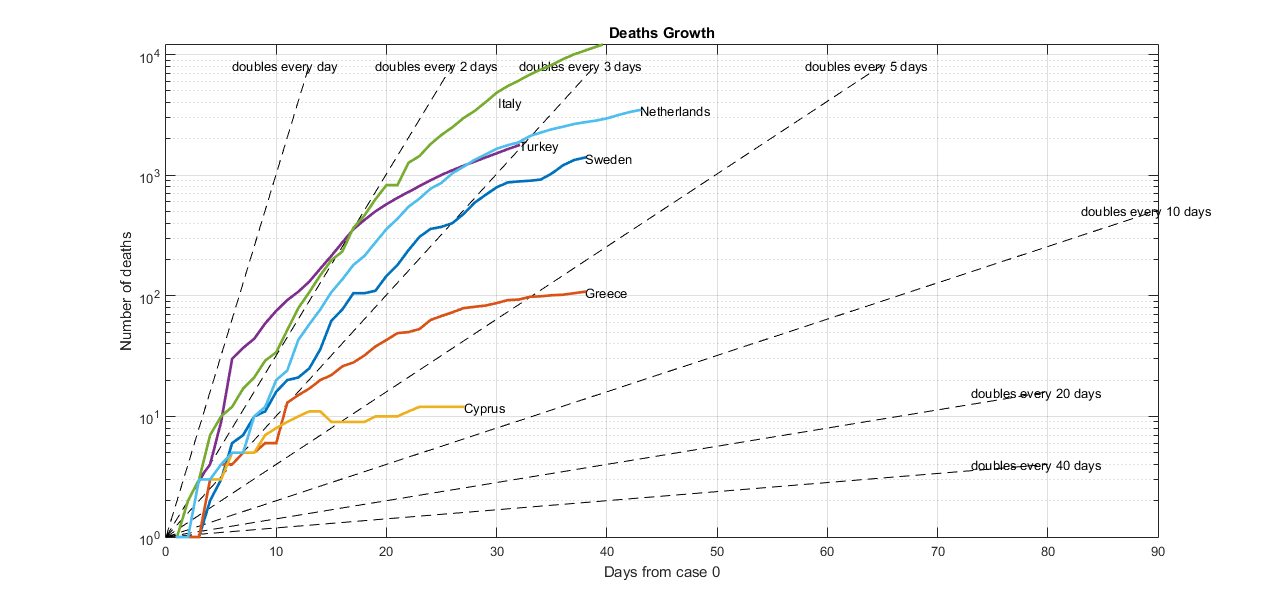
Deaths and cases growth rates
Scientific background:
The projections are based on Richard’s model [1]. Unlike the SIR model [2] that accounts for the mechanisms of transmission, Richard’s model is based on an empirical function derived from the General Logistic Growth model, which has been shown to demonstrate the natural course of biological growths including that of the infected people during an epidemic. It has been a mystery that this empirical function has made many incredible coincidences with real ecological or epidemic data, before its parameters were actually correlated to actual biological and epidemiological data.
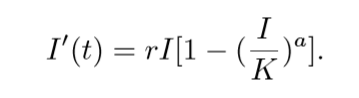
The Richard’s model is described by the following non-linear differential equation:
The solution of the above equation gives:
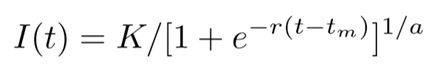
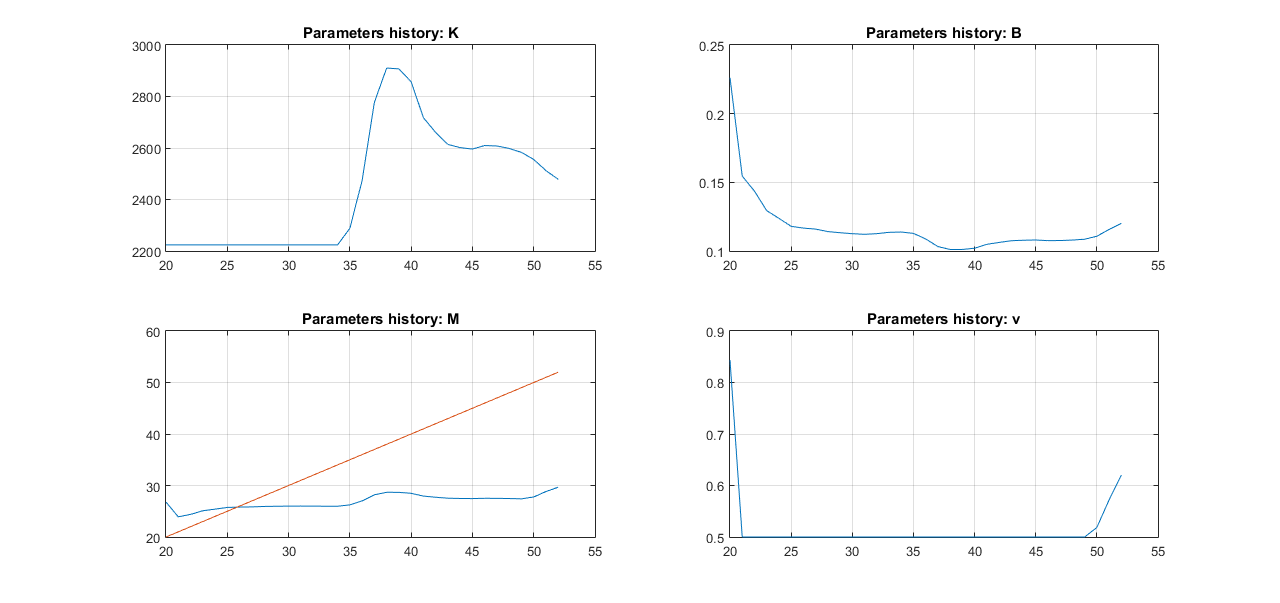
Where I(t) is the cumulative number of infected people (cases), r is the per capita growth rate, K is the infection capacity (essentially the steady-state value) and tm is the time of the inflection point or the time at which the slope of the graph starts reducing. α causes deviation from the basic curve and it has been linearly correlated to the reproduction number r0.
How to interpret the curve:
As with every predictive model, the chance that we can use Richard’s model to accurately predict the course of a pandemic early-on, is low. Nevertheless, the curve can be used as an indication of the current trends with reference to a natural epidemic growth. It can show us the shape of the total covid-19 cases increase over time, and whether currently, we are heading steadily towards our projected target or whether we need to improve our response, i.e. by increasing measures.
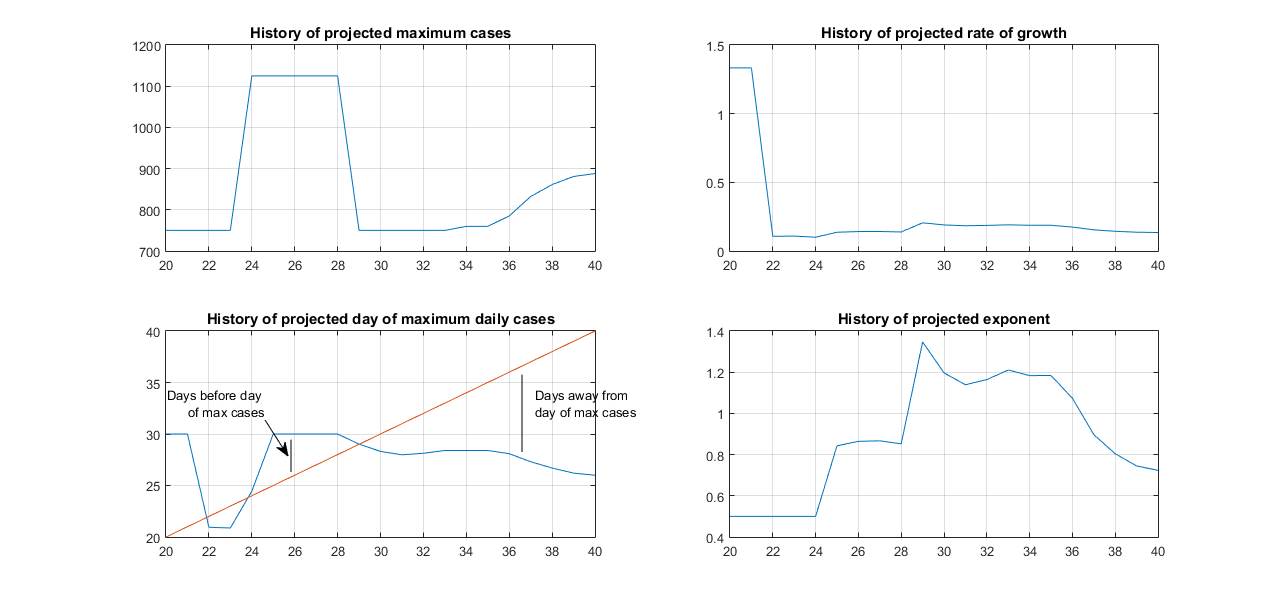
Further, our research work which is not peer reviewed yet, shows that if we plot the history of the 4 model parameters, we can have a view of the current day-by-day trends of the projections. Convergence of all 4 parameters indicates that there is a high chance the current projection can be correct if it is used for a forecast.
Analyses are being carried out by Evagoras Xydas (IREROBOT LTD) and Prof. Konstantinos Kostas (Nazarbayev University, Kazakhstan). The post depicts the personal opinion and data interpretation of E. Xydas who is not an expert in epidemiology or any similar field.
[1] Hsieh, Ying-Hen. (2009). Richards Model: A Simple Procedure for Real-time Prediction of Outbreak Severity. Modeling and Dynamics of Infectious Diseases Series in Contemporary Applied Mathematics (CAM). 11. 10.1142/9789814261265_0009.
[2] Kermack, W. O. and McKendrick, A. G. “A Contribution to the Mathematical Theory of Epidemics.” Proc. Roy. Soc. Lond. A115, 700-721, 1927.