
If anyone wants to receive updates email me at: evagoras.xydas@irerobot.com
Here I present my own projections of the COVID 19 outbreak in Cyprus. I am not an expert and therefore the data presented here can be considered as a mere indication of the current trends of the outbreak. Also, the graph presented can serve as a reference: if the reported cases digress higher than the model curve, things are going badly, and of course the opposite is desired. The model excludes the quarantined students that have returned from abroad. In general even expert modelers around the world have hard time carrying out validated predictions: this is a new and unknown virus with many unknown characteristics such as the reproduction number (r0) which is roughly approximated to somewhere between 2 and 3.
What follows is a projection and fitting based on the Richard’s model [1]. It has been a mystery that this empirical function has made many incredible coincidences with real ecological or epidemic data given the weak correlation of its parameters to actual biological and epidemiological data. The Richard’s model is described by the following non-linear differential equation:
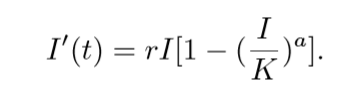
The solution of the above equation gives:
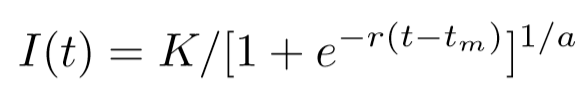
Where I(t) is the cumulative number of infected people (cases), r is the per capita growth rate, K is the infection capacity (essentially the steady-state value) and tm is the time of the inflection point or the time at which the slope of the graph starts reducing. α causes deviation from the basic curve and it has been connected to the reproduction number r0.
Without getting into too much detail the above model is fitted on the current data in Cyprus and also on the existing data for the Hubei province in China. The graphs, for comparison purposes, show the number of cases per million people, therefore in the case of Cyprus the observed values should be multiplied by 0.7.
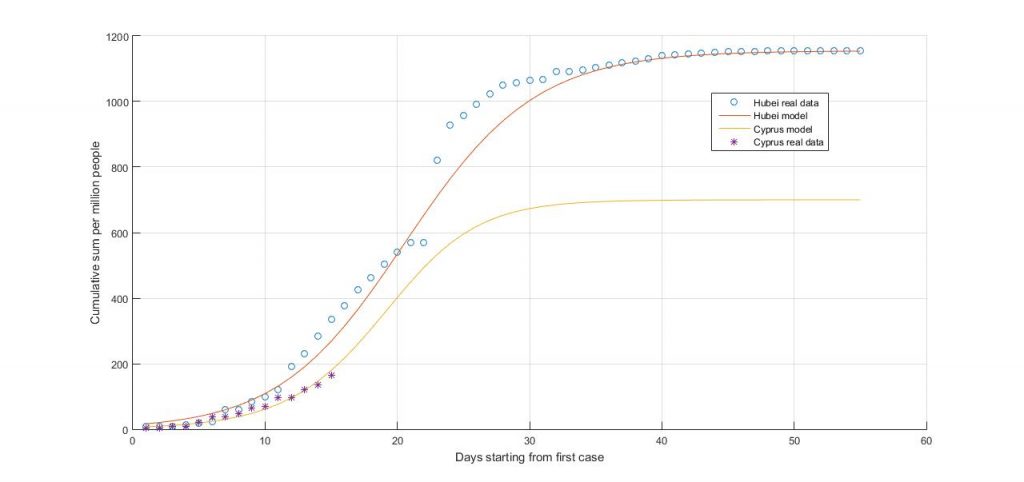
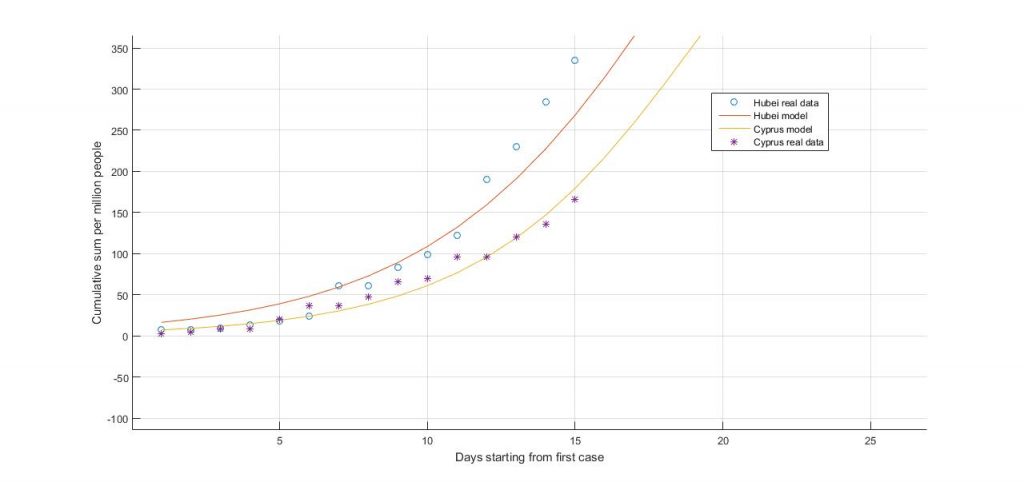
Given the above graphs, some predictions for the coming days:
23/3/2020: 25 – 30 new cases
24/3/2020: 30 – 35 new cases
25/3/2020: 23 – 28 new cases
Peak number of cases is expected to be 487 cases and will occur 22 days from now (mid April). After that the cases will start reducing. The Richard’s model considers the enforced measures taken as well.
The predictions as well as the new cases will be updated frequently. New fitting will take place every 2-3 days as well. Further the models will be updated and assessed. SIR model will be incorporated at some point as well.
Cover photo by Georg Eiermann on Unsplash
[1] Hsieh, Ying-Hen. (2009). Richards Model: A Simple Procedure for Real-time Prediction of Outbreak Severity. Modeling and Dynamics of Infectious Diseases Series in Contemporary Applied Mathematics (CAM). 11. 10.1142/9789814261265_0009.