
In this post new projections are presented, these use empirical models [1]. These models cannot be accurate yet, but can only indicate a trend for the coming days. By plotting the evolution of some of the model parameters, as it is explained, it can be observed whether the model is still sensitive to new data, or whether it has settled and can perform “accurate” predictions (“accurate” is in quotes because it is always risky to use such terms with predictive models). At the end of the text, there is a projection that uses the Susceptible, Infected, Removed (SIR) model, and some interesting statistics, as well [2].
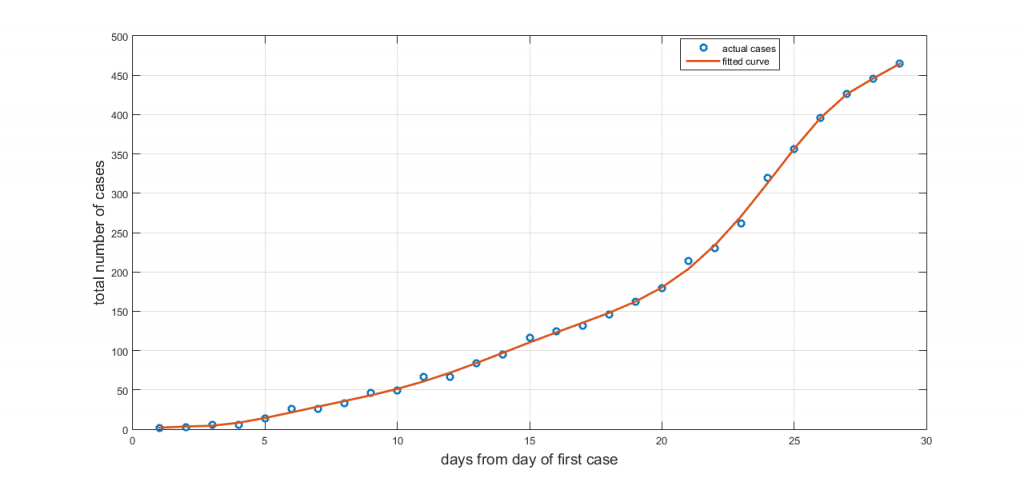
As we have explained, Richard’s model is empirical, which means that it is based on a function that has shown to describe biological population growth and other biological growth processes, including epidemics. It does not consider the mechanism of interaction between the physical quantities involved in an epidemic, as the SIR model does. Unfortunately, the specific model is really sensitive to sudden spikes in the number of cases and especially, as it seems, to abrupt inflection points. Therefore, to improve the model we performed a smoothing of the data. Figure 1 shows the cumulative total number of cases until April 6th compared to a fitted 9th order polynomial. A 9th order polynomial has been chosen so that smoothing is not “too good”. In this way the “spikes” disappear while most of the information is maintained.
The updated projection for the cases that were announced in Cyprus until April 7th is shown in figure 2, for the total number of cases, and in figure 3 for the daily number of cases. We believe that in the coming days we will carry out a new projection in which the maximum number of cases will reduce. This is because right now, the model is at a “sensitive” period in which even small fluctuations cause large increase or decrease in projections. The model is not settled yet.
As mentioned above, currently the model is at its most sensitive period, because of appearance of a possible inflection point, where the second derivative becomes zero. The sensitivity of the model can be evaluated by looking at how the projected parameters change when incorporating different number of days with known number of cases. Figure 4 presents the parameters’ variation for China. China’s has been chosen because there, the situation is now stable. The figures represent the different parameters employed in the Richard’s model. We can see that the constants fluctuate until they finally stabilize.
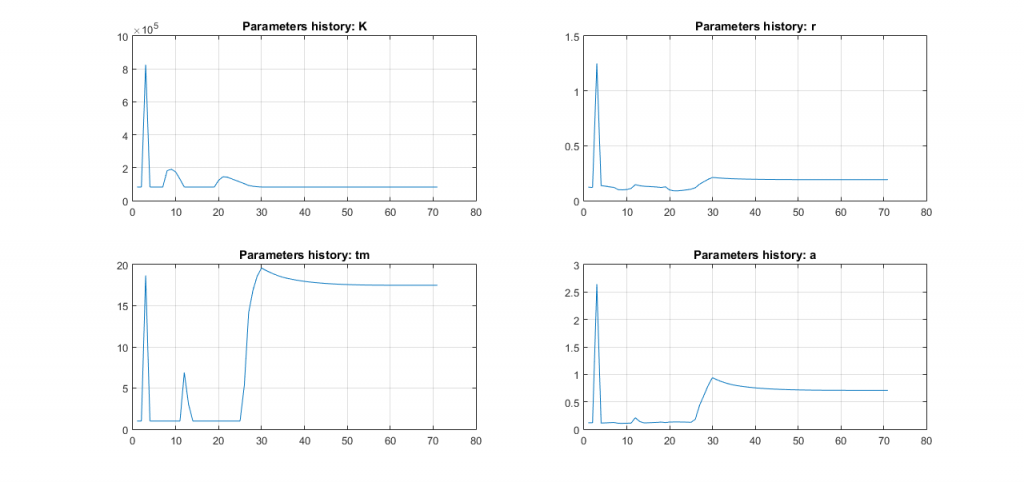
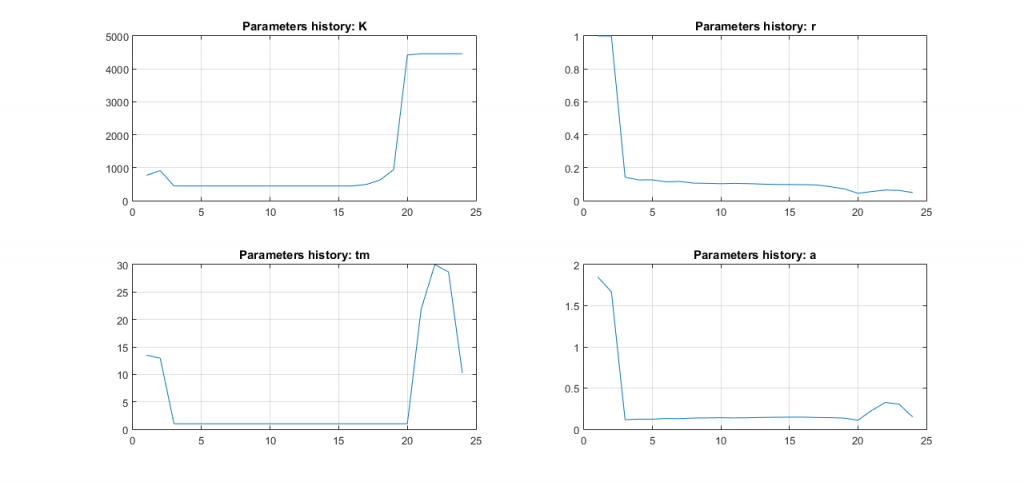
Figure 5 shows the evolution of parameters for the case of Cyprus. We can see that they haven’t stabilize yet, therefore, the Richard’s model can only be used to indicate the current trends, and probably, be used as a reference.
According to the China model, as well as other examples, we can naturally expect a fall in the maximum projection values. Also, when the parameters stabilize, we will be able to project a total number of cases with more accuracy.
Figure 6 shows the growth rates of Cyprus, Norway and Greece. Norway is chosen because age-wise it correlates well to Cyprus.
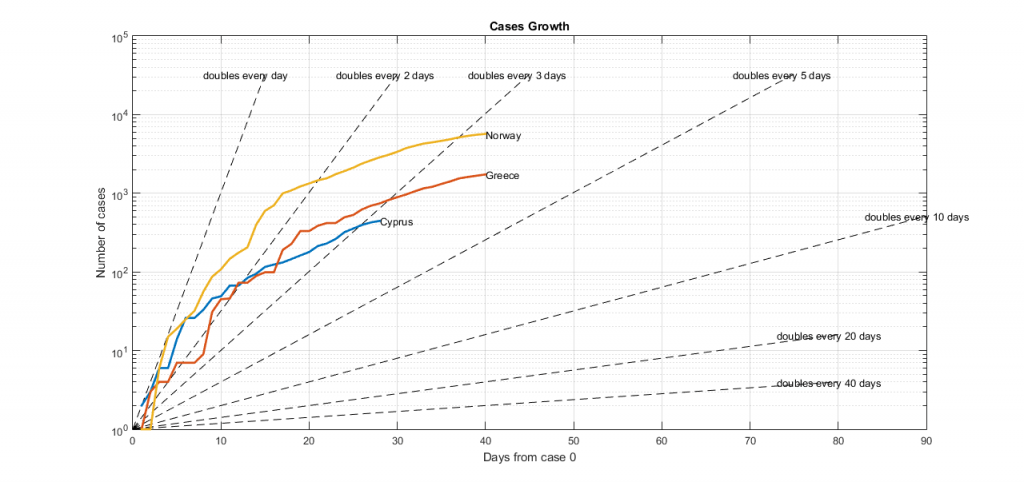
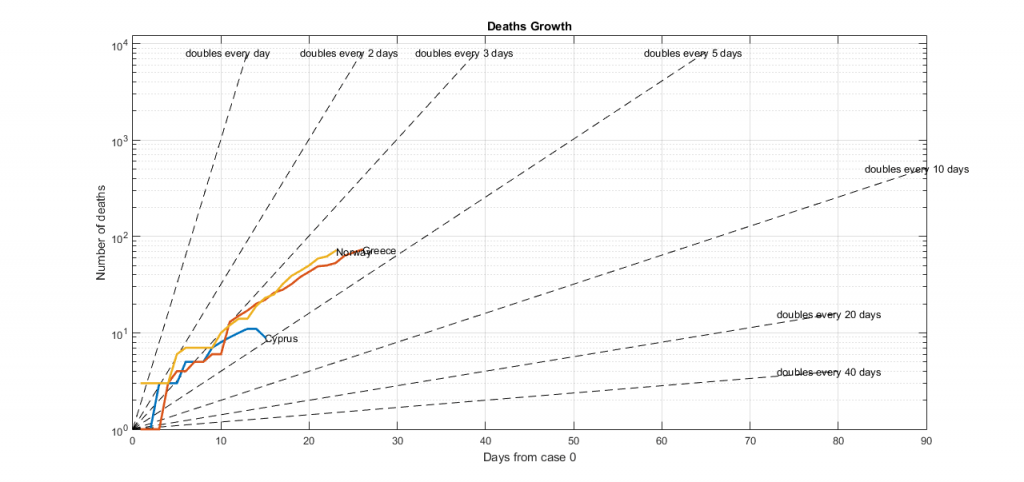
Figure 7 shows the deaths for the same countries. Surprisingly enough, Cyprus is now the only country with total death rate that reduces! This is because due to a new protocol that was implemented, some of the deaths were attributed to other causes after all.
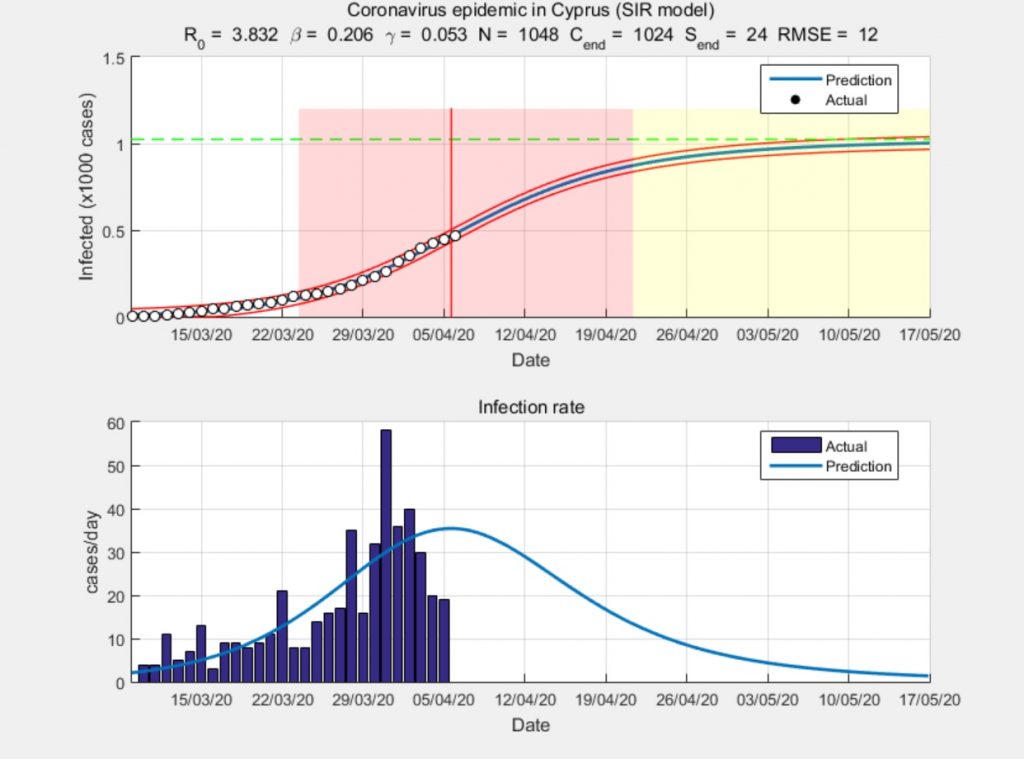
Finally, the SIR model, implemented for Cyprus, is shown in Figure 8. The SIR model is more deterministic although not necessarily more accurate. The reason is that it is more sensitive to incomplete data, and it normally needs to consider separate clusters with different dynamics (i.e. Aradippou or Paphos) etc.
Analyses are being carried out by Evagoras Xydas (IREROBOT LTD) and Prof. Konstantinos Kostas (Nazarbayev University, Kazakhstan). The post depicts the personal opinion and data interpretation of E. Xydas who is not an expert in epidemiology or any similar field.
Cover photo by Brian McGowan on Unsplash
[1] Hsieh, Ying-Hen. (2009). Richards Model: A Simple Procedure for Real-time Prediction of Outbreak Severity. Modeling and Dynamics of Infectious Diseases Series in Contemporary Applied Mathematics (CAM). 11. 10.1142/9789814261265_0009.
[2] Kermack, W. O. and McKendrick, A. G. “A Contribution to the Mathematical Theory of Epidemics.” Proc. Roy. Soc. Lond. A115, 700-721, 1927.