Note: graphs are updated every day until there is a new post. The new cases are shown with reference to the projection on the 30th of March. They are not included in creating the actual projection.
[This is an interactive graph: hover over the lines to read the values]
The projection of total cases predicted by the Richard’s model [1] has changed significantly over the last few days with a sudden increase in confirmed cases, a change in slope, and doubling of the predicted duration and maximum values of cases. Nevertheless, this fact can be interpreted in different ways: 1. the frequency of testing has increased dramatically. This means that identification of new cases will be more effective and faster, therefore, more asymptomatic carriers will be included. Consequently the projection represents a prediction of the confirmed cases, which are now more due to extensive testing. 2. increased testing means that more asymptomatic carriers will be quarantined and this means that the virus transmission will eventually reduce, with reference to the announced cases (this is all we can know with certainty). 3. the surge in confirmed cases is also the result of social interaction that took place before the aggressive quarantine measures were effective. Figure 2 depicts the predicted versus the actual daily cases over time.
[This is an interactive graph: hover over the lines to read the values]
As we mentioned earlier, the initial approach “to stop the virus in its tracks” has failed and the pandemic diffused inside society, as experts asserted as well. After that, dynamics changed completely and what we see is the result. Nevertheless it is expected that due to the aggressive measures the dynamics will reset again to a more hopeful projection. This is a critical time for the future of the pandemic in Cyprus and measures should be implemented with a high degree of compliance.
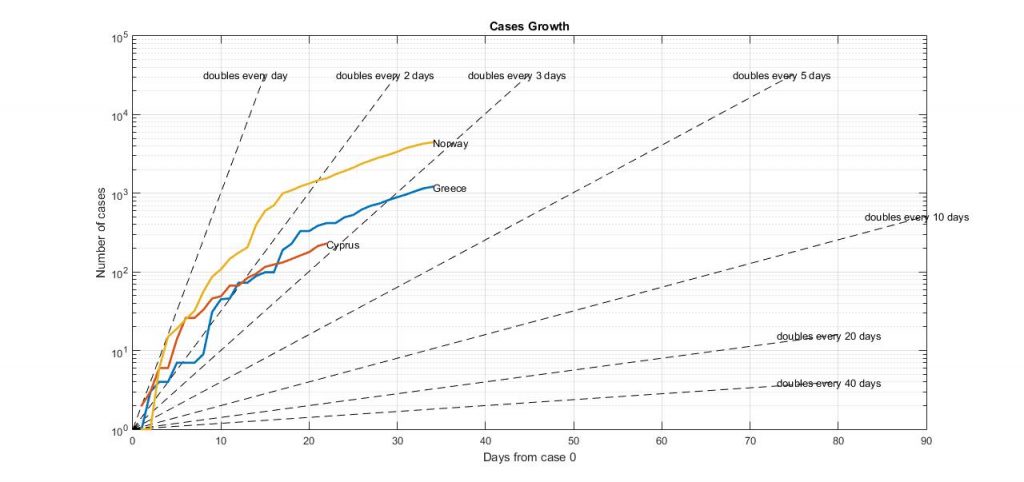
To further evaluate the current situation in Cyprus we can compare the doubling rate of cases to other countries. Figure 3 shows comparison of growth between Cyprus, Norway and Greece. Norway was chosen because it shares similar age-demographics to Cyprus. The doubling rate can be found by matching the slope of each country’s graph (the upper part) to the respective line that represents a doubling rate. It is observed that all three countries currently approximate the “double every 10 days” slope.
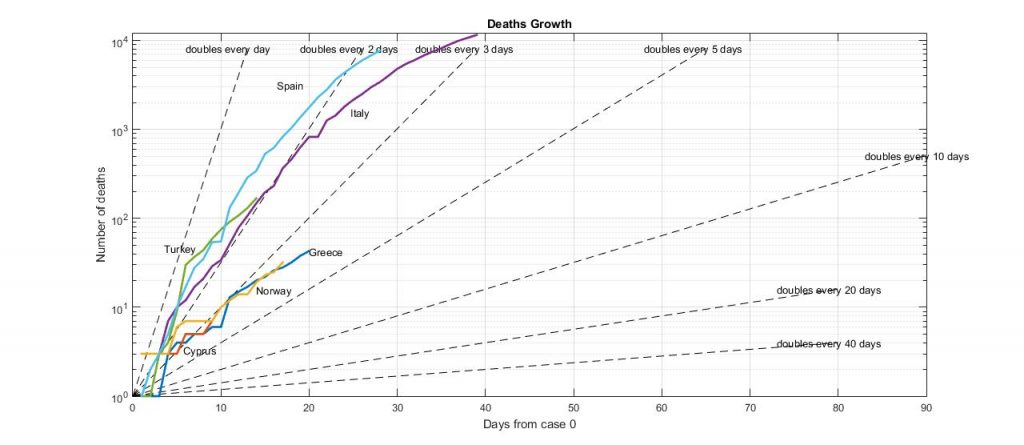
In order to better understand the situation, Figure 4 compares Norway, Greece and Cyprus to countries facing more severe situations, like Italy, Spain and Turkey. It can be seen that the doubling of cases in these countries takes place almost every three days, while Turkey approaches a day-by-day doubling growth rate.
What can we expect: given the doubling-rate reduction tendency which roughly aligns to Richard’s model inflection point and asymptotes, we hope to see a change to a new projection after the measures are in effect. Nevertheless, the government of Cyprus should already be putting an exit strategy in place. Literature and experts as well as the WHO recommend that we perform extensive and random testing in order to quantify the true extend of the pandemic. Identifying asymptomatic carriers (which can be from 20-100 times more than the actual confirmed cases according to some experts) who became immunized can allow us to have a large number of people returning to their works early on, therefore giving a boost to the economy and market which is currently in a state of pause.
Remember: Richard’s curve is based on an empirical mathematical model which shows the profile of the natural evolution of the pandemic. It is not magical, but has shown to be efficient in predicting the severity of pandemics and providing an indication of “where we are heading to” with reference to “where we want to go.”
*The post will soon be updated with more specific references.
Analyses are being carried out by Evagoras Xydas (IREROBOT LTD) and Prof. Konstantinos Kostas (Nazarbayev University, Kazakhstan). The post depicts the personal opinion and data interpretation of E. Xydas who is not an expert in epidemiology or any similar field..
Cover photo by Brian McGowan on Unsplash
[1] Hsieh, Ying-Hen. (2009). Richards Model: A Simple Procedure for Real-time Prediction of Outbreak Severity. Modeling and Dynamics of Infectious Diseases Series in Contemporary Applied Mathematics (CAM). 11. 10.1142/9789814261265_0009.