This is a follow-up post for the previous two posts on March 23, 2020 and March 25, 2020.
Real-time stats on COVID 19 outbreak in Cyprus are generated by Algolysis.
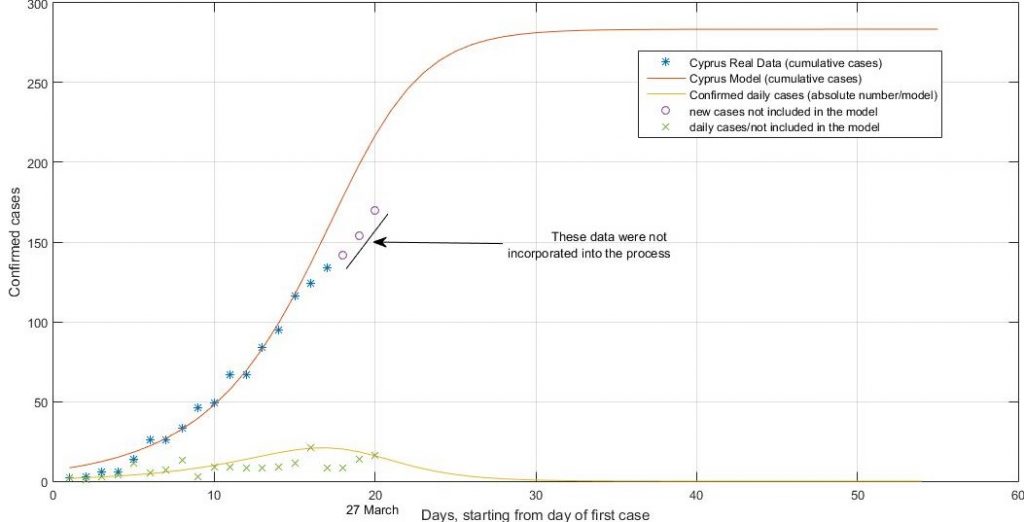
With reference to the model-predicted curve, a deviation is observed with regard to the last 5 reported number of cases as it is seen in figure 1. Overall, the total number of cases are less than the predicted ones but do not fall far-off the predicted trajectory. Nevertheless, the new “branch” tracked by the new cases grows exponentially, faster than the model-predicted curve. This can be the result of random variability in the reported cases or the result of a new wave due to diffusion of infection in the society as experts fear. Too early to say, let’s wait and see.
The discontinuity may also represent a sharp inflection point due to the measures enforced by the government of Cyprus on the 23rd of March.
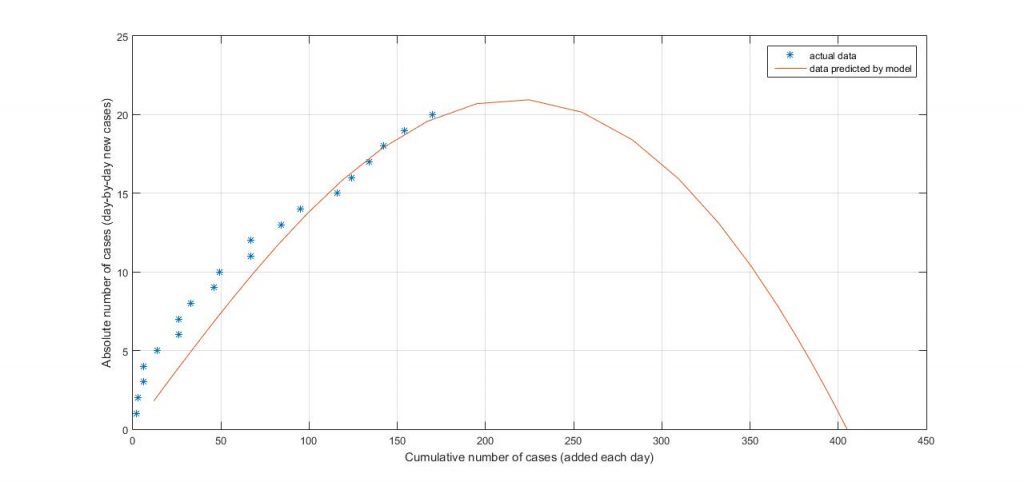
To get a better look, we use a different approach to look at the data. Below (figure 2), the cumulative, or total number of cases is plotted against the absolute number of cases (day-by-day new cases). On the same graph we plot the cumulative number of cases predicted by the model versus the predicted day-by-day absolute cases (which is the first derivative). The graphs show that the actual data still follow the predicted curve closely. They also show that the next days are critical. We want to to stick to the curve rather than flying-off to a peak at a higher spot. It’s still not clear if we have a discontinuity due to a new wave or because of chance, or due to variability.
Overall, the results suggest that we will see an increase of cases in the next days but it’s not sure whether they will keep growing exponentially or trend to lower rates soon after. Updated analysis and data using different approaches will follow soon.
UPDATE: our model predicted 16 ± 4 cases today (28th of March) and the actual announced case figure is 17.
Prediction for the coming days:
29 March: 15 ± 4
30 March: 11 ± 4
31 March: 7 ± 4
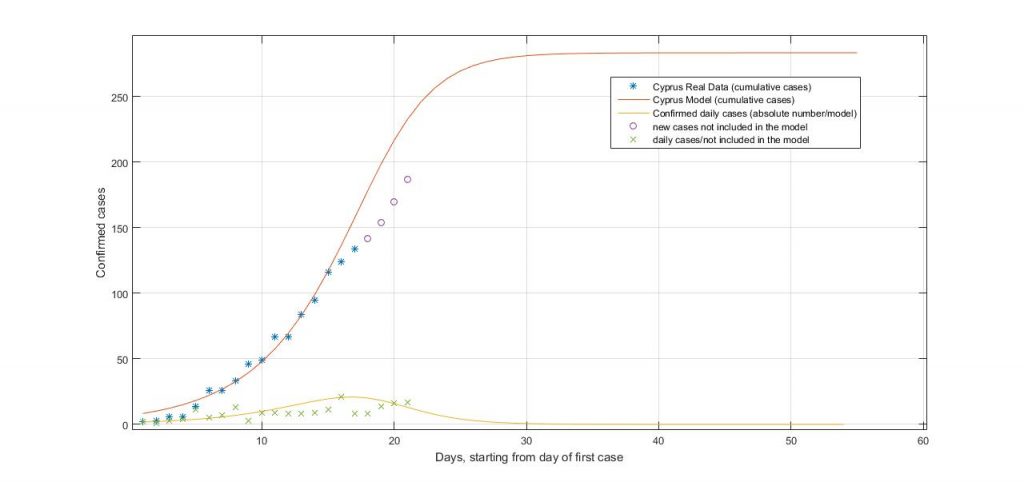
The updated data including the 28th are shown in figure 3. The exponential growth of the new “branch” still stands. A new separate curve-fit will take place if exponential growth persists.
Author: Evagoras Xydas
evagoras.xydas@gmail.com
Cover photo from Martin Sanchez, on unsplash.