
Evagoras Xydas
Here we present new fitting of data and projections based on the Richard’s model as a follow-up on the post of 25/03/2020.
Current statistics for Cyprus are provided by Algolysis LTD at this link.
Please be reminded that:
a. I am not an expert in epidemiology. You can read my short bio here.
b. The existing data are not enough for accurate predictions. Yet the results do demonstrate the current trends and short-term forecasts.
c. Interpretation of the data is your own responsibility, it is not recommended to use them for any purpose other than merely being informed for the current trends.
We are using existing and well-established models that have shown to fit pandemic and epidemic growths. One can understand through them how the natural course of a single-wave pandemic looks.
For the confirmed cases up-until March 24th, the following graphs are generated:
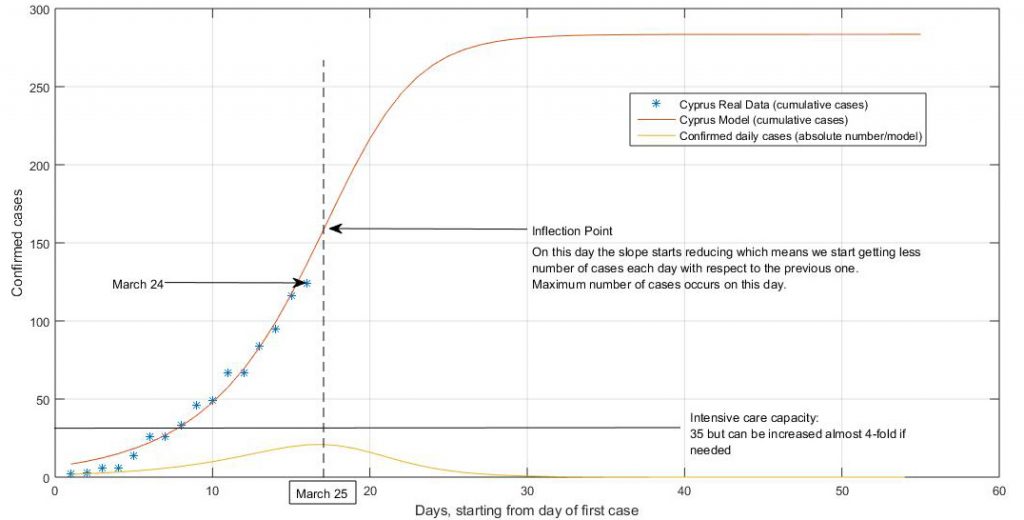
Figure 1 suggests that:
- Theoretically today we will have the maximum number of cases and after today they will start reducing.
- We predict a total number of cases 283 by April 10th. Then we get saturation (no more or minimal new cases).
- If 30% of cases need hospitalization then in the worst case scenario we will require 84 intensive care beds. The current capacity is 35 but can increase to 125 when needed.
- The inflection point usually takes place when the effect of the measures (social distancing) takes place. This makes sense since the inflection point is on March 25, few days after the first measures have been implemented.
Projections for the next days:
March 25th (today): 26-34
March 26: 17 – 25
March 27: 16 – 24
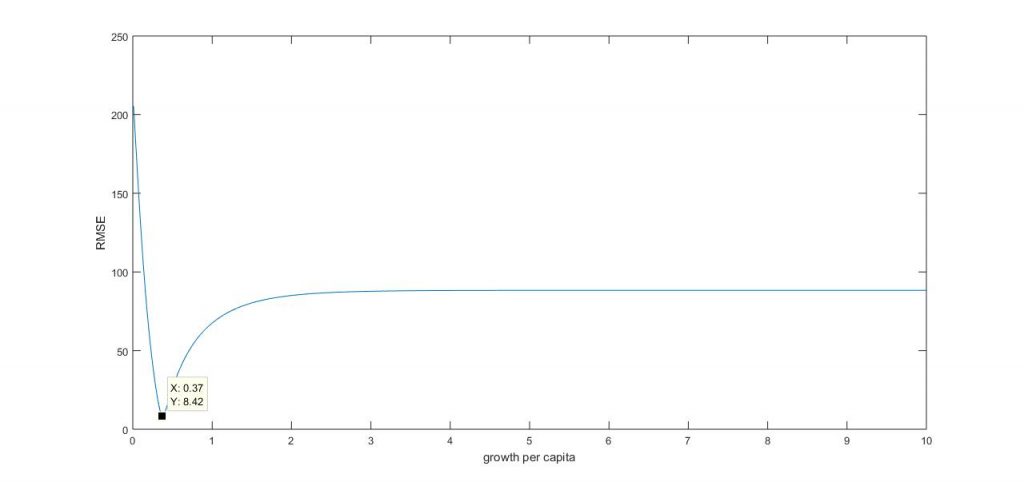
The data were refitted after the confirmed cases of 21 and 8 people on the 23rd and 24th of March respectively. Our predictions on those days were 25-30 and 30-35 cases respectively. Re-fitting took place by minimizing the Root-Mean-Square of errors (RMSE) between the existing data and the data generated by the model. The total RMSE is currently around 8 (in absolute cases number) which is still a lot. As an example a graph of the RMSE versus varying the growth rate per capita (r) on Richard’s model is shown in Figure 2.
The data for the analyses are retrieved from: https://data.humdata.org/dataset
Cover photo: Photo by Markus Spiske from Pexels
Kermack-McKendrick or SIR model
The SIR model is a more involved model than the Richard’s model. It consists out of three groups: The Susceptible people (S), the Infected (I) and the Removed (R) [1]. In the S-group are the people who are not currently infected but can be infected, I-group those who are infected and R-group are those who are diseased or have recovered or have a natural immunity. S(t) + I(t) + R(t) = N. Although S, I and R change with respect to time, N is constant and can represent the total population of the three groups. S, is not, i.e. the whole population of a country. Instead, given a number of infected people (I) it is the number of people that can be infected by a single individual per unit time. It all starts with infected individuals. For example, if initially a single person in a country is infected, and the effective contact per unit time times the whole population is 3, then S = 3, I = 1 and R = 0 at time 0. Now if at t=1 one of the previously susceptible individuals catches the disease then S = 2 + 1.3 = 5, I = 1 and R = 1 (if the previously infected individual has recovered. The population N, has now increased as well. This is the logic. The SIR model is described by three differential equations as follows:
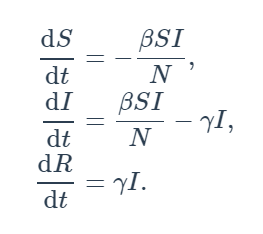
β describes the effective contact rate of the disease: an infected individual comes into contact with βN other individuals per unit time (of which the fraction that are susceptible to contracting the disease is S/N. γ is the mean recovery rate: that is, 1/γ is the mean period of time during which an infected individual can pass it on.
Happily, Joshua McGee and Milan Batista have provided a full numerical solution for the SIR model given the current pandemic. We adapted the data for Cyprus up-until the 24th of March and generated the respective projection.
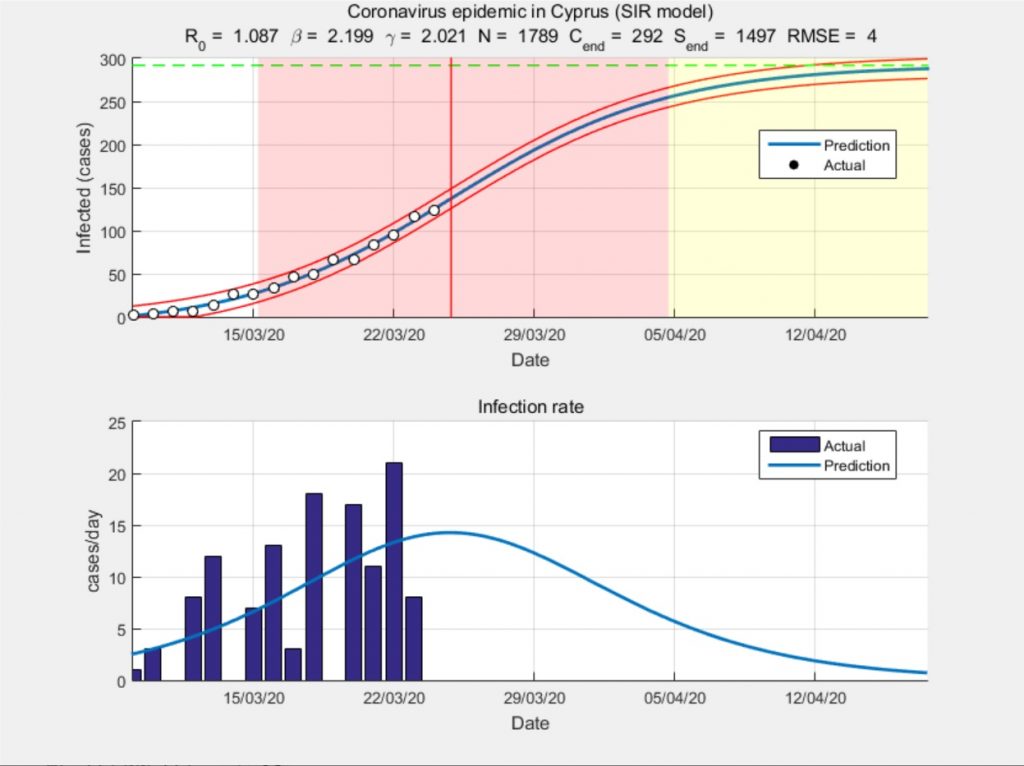
As it can be observed, currently, the Richard’s and SIR models are in relatively good agreement. The generated trajectories can serve a reference.
[1] Kermack, W. O. and McKendrick, A. G. “A Contribution to the Mathematical Theory of Epidemics.” Proc. Roy. Soc. Lond. A115, 700-721, 1927.
*The specific source was provided by Christos Kouppas